I’ve been working in marketing long enough to remember when “competitive intelligence” meant lurking in Facebook’s Ad Library and cobbling together spreadsheets filled with educated guesses.
These days, we have tools that can shine a light on all that confusion: like AdClarity.
This tool promises to track over 650,000 publishers across 51 countries, all in near real time. That’s a big promise.
That’s a lot of eyeballs, and in theory, a lot of receipts on where the money in your competitor’s marketing campaigns is really going.
So, how useful is AdClarity really? Over the past few weeks, I’ve pulled reports, set up alerts, tested every filter I could find to find out.
What is AdClarity and How Does It Work?

AdClarity is basically a live window into the ad universe your competitors are paying to occupy.
It doesn’t matter if they’re buying banner space on obscure lifestyle blogs, running pre-roll video on YouTube, or pushing carousel ads into your Instagram feed.
If it’s out there, there’s a good chance AdClarity is tracking it.
Under the hood, all this raw data: impressions, placements, frequency, gets processed through machine learning models.
These models clean up the inconsistencies and map everything back to known brands and campaigns.
The result is that you can open up a dashboard and immediately see not only which creatives are live, but also how long they’ve been running, where they’re showing up, and roughly what the spend looks like.
What is AdClarity? Exploring the Features
The first time you log into AdClarity, you’ll probably have a moment where you think, “Wow, this is a lot.” It feels more like a professional research suite than a plug-and-play app.
That’s a good thing for companies that need a more advanced competitive intelligence experience, but there is a learning curve. The good news is you can adjust AdClarity to suit your needs.
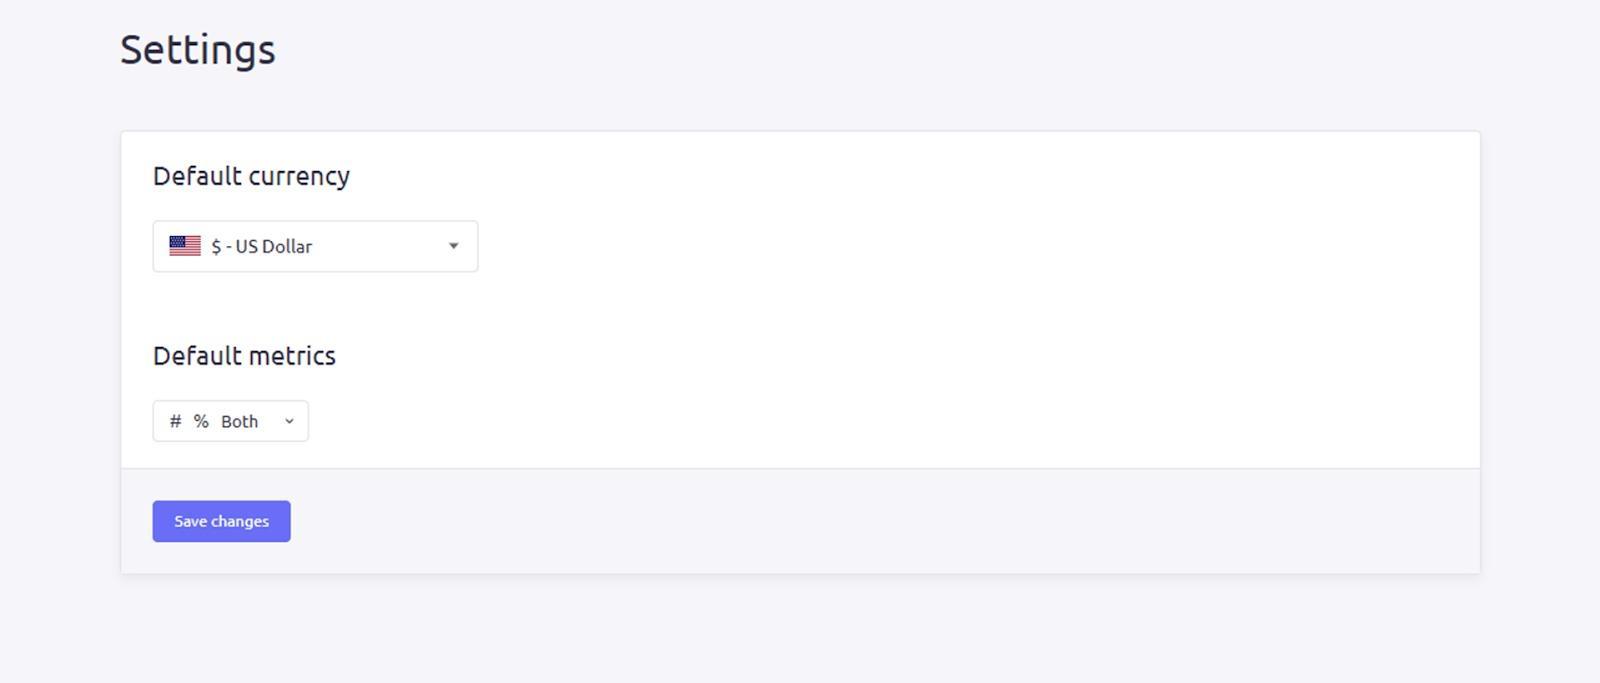
Once you log in, you’ll pick your main market. For me, that’s usually the U.S., but you can set it to any country you want.
This choice decides which data shows up first when you open reports. If you work internationally, it’s worth taking a moment to set this up carefully so you don’t keep flipping back and forth later.
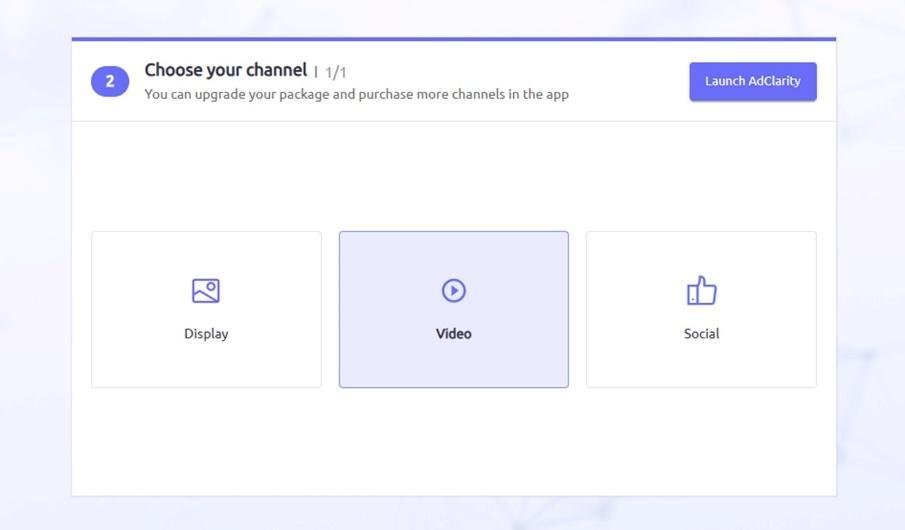
Then you pick the channels you care about. This is where it gets interesting. You’re not forced to look at everything at once.
You can zoom straight into, say, TikTok or Google Display. I’ve found that if you try to pull all channels into a single view at first, it can feel like you’ve dumped a whole warehouse of numbers onto your screen. Starting small is usually easier.
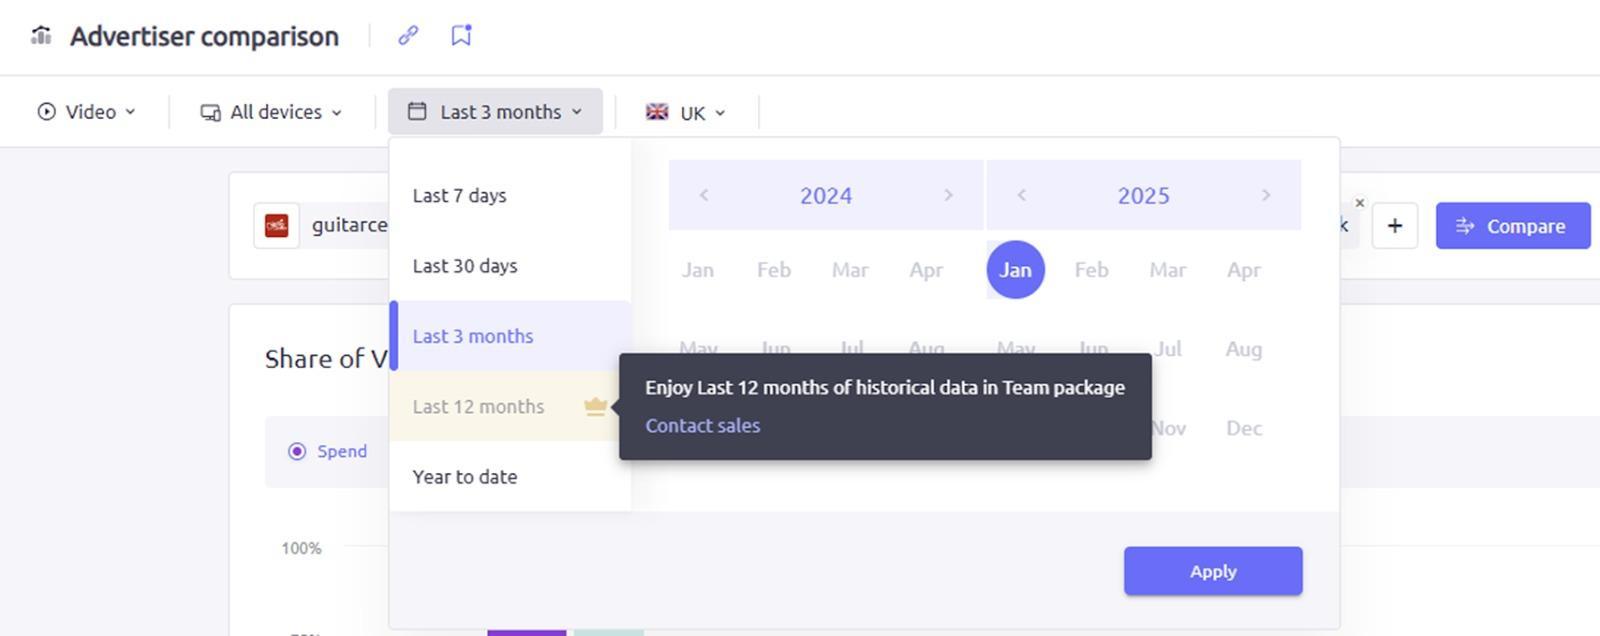
The filters are where you can narrow everything down by device: desktop, mobile, in-app. You can also focus on a date range, like the last 30 days or the past year if you have one of the higher plans.
Let’s dive a little deeper.
Ad Formats and Channels
This section is where AdClarity really starts to stand out.
The platform doesn’t just spit out a list of “some ads somewhere.” It shows you exactly where brands are spending their money and what formats they’re leaning into.
You can see whether a competitor is going heavy on banner ads, or if they’re quietly dumping budget into pre-roll video that you’d never know about just scrolling LinkedIn.
One thing I noticed right away is how granular it gets. You’re not stuck with vague labels like “video” or “social.”
You can actually see whether it’s an in-feed video ad on Facebook, a mid-roll YouTube spot, or a little banner tucked inside a mobile app.
It also breaks everything down by device. You’ll see whether campaigns are mostly targeting desktop browsers or if they’re optimized for mobile.
My advice here? Don’t feel like you have to track everything at once.
That’s a fast way to get buried in data you don’t actually need. Instead, pick one or two areas where you know you have competition breathing down your neck. Once you’re comfortable, then branch out.
The Reports: Your Options on AdClarity
If you’ve ever tried to figure out what another brand is up to with their ads, you know it’s usually a mix of digging around, making educated guesses, and hoping you didn’t miss anything important.
One of the things I appreciate most about AdClarity is how it breaks all that uncertainty into clear, organized reports you can actually do something with.
There are four main report types. They each focus on a different angle, and once you start flipping between them, you begin to see patterns you wouldn’t catch otherwise.
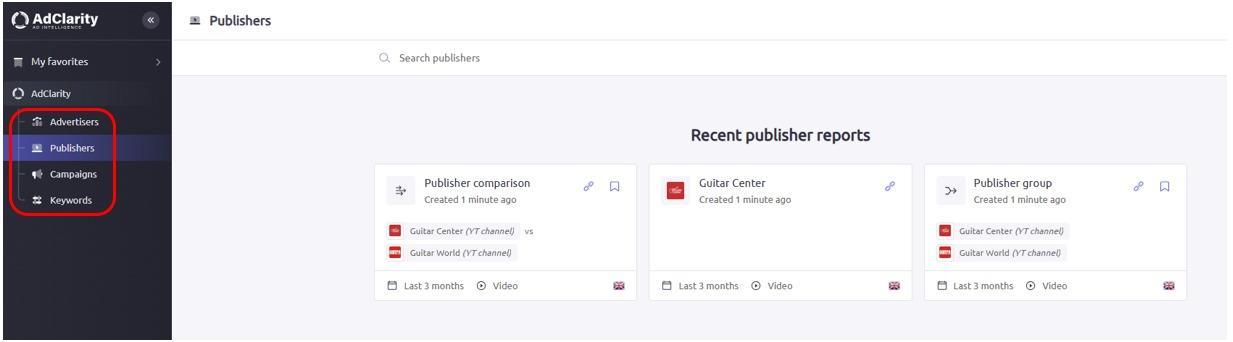
- Advertiser Reports are probably the first place you’ll want to look. These lay out exactly what a brand is running, down to the start and end dates, which sites or apps they’re using, and how often the ads appear. It’s a lot easier to plan your own campaigns when you can see those early moves in context.
- Publisher Reports take the opposite perspective. Instead of asking “What are they buying?” you’re asking, “Where are all these ads showing up?” Sometimes you’ll notice the same publisher popping up for several competitors, which is usually a sign it’s worth a look.
- Campaign Reports are where you can really dig into the creative details. You don’t just get a headline or a vague description, you see actual examples of the banners, videos, or carousel ads themselves, along with how many impressions each version got.
- Keyword Reports focus on search advertising. They’ll show which keywords campaigns are targeting, how often they appear, and give you an idea of what competitors might be spending. If you’ve ever tried to figure out why your own CPCs suddenly spiked, it’s useful to check whether someone new started bidding on the same terms.
One thing that surprised me is how smoothly you can jump from one report to another.
Say you’re looking at an Advertiser Report and you want to see exactly which creatives they used in that timeframe; it just takes one click to open the Campaign Report.
You don’t have to start over or re-enter filters.
Comparing, Grouping, and Filters
This part of AdClarity is probably where most companies will spend the most time. It’s one thing to see what a single competitor is doing, but the real value comes when you can line them up side by side and see exactly how everyone stacks up.
There are two ways to look at multiple brands or domains at once: grouping and comparing. When you create a group, you’re blending everything into one big pile of data.
If you pick five competitors and group them, you’ll see the total spend and total impressions across all of them combined.
This is handy if you just want to see the overall size of your competitive landscape without worrying about who’s responsible for which piece.
When you compare, each brand stays in its own lane. You get separate data for each one, so you can see exactly who’s investing the most, who’s testing new formats, and who’s pulling back.
Personally, this is the mode I use most often. I find it easier to spot trends when nothing is mashed together.
You can line up to ten domains or brands in a single comparison. For most teams, that’s plenty. If you’re in a massive category with dozens of active advertisers, you might need to break it into batches.
Filters in this section work the same as everywhere else. You can narrow results by date range, channel, device type, or geography.
One detail I didn’t appreciate enough at first: you can save any comparison or group you create. If you’re regularly tracking the same handful of competitors, you don’t have to rebuild the view every time you log in.
Understanding AdClarity Widgets
AdClarity’s widgets probably take the most time to master overall, because there are so many. There’s a really good overview of how all these widgets work on Semrush’s website, but here are the basics:
The Essential Widgets
- Estimated Expenditure shows you a timeline of how much a brand is likely spending, broken down day by day or month by month. You can also see percentage changes. So if spending suddenly jumps 200% in a week, you’ll catch it right away. There’s also an expenditure trends widget, to show you how spending is changing over time.
- Ad Type Distribution breaks down the formats advertisers are using – covering everything from display banners to carousel posts to in-feed videos. This one helps you spot when a company is shifting their focus.
- Ad Placement shows exactly where those ads appear on the page or screen. It’ll tell you if something’s above the fold, below the fold, pre-roll, mid-roll, or post-roll. If you’re trying to see whether a competitor is paying for premium visibility or just filling remnant inventory, this makes it a lot clearer.
- Ad Buying Methods gives you a sense of how the ads are purchased. You can see whether someone’s going direct to publishers, using programmatic auctions, or buying through a network. The widget also shows more granular breakdowns like programmatic direct vs. programmatic guaranteed.
- Top Ads, Campaigns are where you can preview actual creatives. You’ll see thumbnails of the ads, the formats, dimensions, and how often each one has been served. You can sort by views, recency, or duration.
- Top Publishers and Apps highlights which sites or apps are serving the most impressions for that brand. If you’re trying to figure out where to allocate your own budget, this is an obvious place to start.
The Bonus Widgets
- Share of Voice only shows up when you’re comparing multiple advertisers, but it’s one of my favorite widgets. It lays out who’s commanding the most impressions and spend across a specific timeframe, displayed as either a heatmap or bar charts.
- YouTube Channels is a widget I didn’t expect to care about but ended up using often. It shows the top five YouTube channels where ads are running, plus the share of impressions and estimated spend. If you do any video advertising, this is worth watching.
- Social Networks breaks down the performance across Facebook, Instagram, LinkedIn, TikTok, Pinterest, and Twitter (or X, if you prefer). You’ll see which channels are getting the biggest share of impressions and how that shifts over time.
If I had to give one piece of advice here, it’s to avoid trying to absorb every widget in one sitting. It gets confusing really fast.
I’d recommend picking two or three widgets that answer the questions you want to answer that day.
Exports and Alerts
There’s nothing more frustrating than finding great data and then struggling to get it out of a platform when you need to show it to your team.
Thankfully, AdClarity makes this part pretty painless.
You can export almost everything to PDF without any limits. The PDFs include all your filters and date ranges, so you’re not stuck cleaning up the formatting later.
Excel exports are available, too, but they’re capped depending on your plan. If you’re on the Professional and Team tiers, you get up to 10 Excel downloads a month, while on Starter you have 5.
Alerts are another great feature. You can set up email notifications for pretty much any report, comparison, or group you’ve saved.
Once you subscribe, you’ll get updates every week or month showing what’s changed: new creatives, spikes in spending, shifts in channel mix.
Pricing and Value for Money
AdClarity isn’t what exactly “budget” software. The plans can be expensive, depending on what you need.
Whether it makes sense to spend the money depends entirely on how seriously you take competitive ad research and how big your media budgets actually are.
- Starter plan: $129 a month. You get access to the core reporting features, but you can only see about 30 days of historical data.
- Professional plan: $298 per month. You get up to a year’s worth of data, which makes a big difference. A lot of advertisers shift strategy over months, not weeks, and without that lookback, you’re basically flying blind. You also get more reports and more exports.
- Team plan: $349 monthly. This is basically the same as the Professional plan, but you get more seats higher export limits, and a few other scaling perks.
Keep in mind, if you need to monitor more than one market, each extra country costs another $69 per month.
If you operate globally, the costs can stack up pretty quickly. As for exports, PDFs are unlimited, which I’ve leaned on a lot for internal strategy decks.
But excel exports are capped per plan. All of this might seem expensive, but it could be worth it.
If your brand is only putting a few thousand dollars into ads each month, you’ll probably struggle to justify the spend.
But if you’re managing six figures a month, or more, and you want to make smarter decisions about where to invest, the visibility you get here can save you a lot of wasted budget.
Is AdClarity Worth It? My Thoughts
AdClarity, is one of the few tools I’ve tried that really delivers on the promise of giving you a detailed, ongoing look at what other brands are doing with their advertising.
It’s not perfect, and it’s definitely not cheap, but it does what it says it does, and that alone sets it apart.
What I like:
- The coverage is genuinely huge, with hundreds of thousands of publishers, dozens of countries, and all the channels you care about.
- I like that the creative previews aren’t buried. You can actually see what’s running without jumping through hoops.
- The filters are flexible enough that you can home in on exactly what you want. I’ve pulled reports just on mobile video campaigns in Germany in about 30 seconds.
- Comparisons and groups are easy to set up and revisit later, which saves time if you’re tracking the same brands over and over.
- The alerts and exports work the way you expect. There’s nothing worse than a platform that makes it hard to share or save the insights you just spent hours uncovering.
What could be better:
- The pricing gets steep, especially once you start adding extra markets. It’s not the kind of tool you grab casually.
- All spend numbers are estimates. They’re good estimates, but you still have to treat them as directional, not exact.
- The learning curve is steep. If you’re brand new to this kind of analysis, expect to spend some time exploring before you feel confident.
Overall, I’d recommend AdClarity if you’re in a role where you need more than a surface-level understanding of where competitors are putting their ad dollars.
If you only run occasional campaigns, it’s probably overkill. But if you’re spending serious money or advising clients who do, it can give you the clarity to make better calls.